I remember standing in a dusty grain elevator three years ago, staring at a batch of what looked like “perfect” corn, only to watch the milling yield tank during processing. It was a gut punch. We had been relying on standard moisture and weight tests, thinking we had everything under control, but we were missing the real story hidden inside the kernel. That was the moment I realized that if you aren’t utilizing Endosperm Density Profiling, you aren’t actually measuring quality—you’re just guessing. Most people in this industry love to hide behind expensive, high-level jargon to justify their costs, but the truth is much simpler and a lot more practical.
I’m not here to sell you on some proprietary, overhyped laboratory miracle. Instead, I’m going to pull back the curtain and show you how to use Endosperm Density Profiling to actually understand your grain’s structural integrity. We are going to cut through the academic fluff and focus on the real-world metrics that impact your bottom line and your milling efficiency. No nonsense, no sales pitch—just the raw, experience-based insights you need to stop leaving money on the table.
Table of Contents
Mastering Grain Quality Assessment Through Internal Mapping
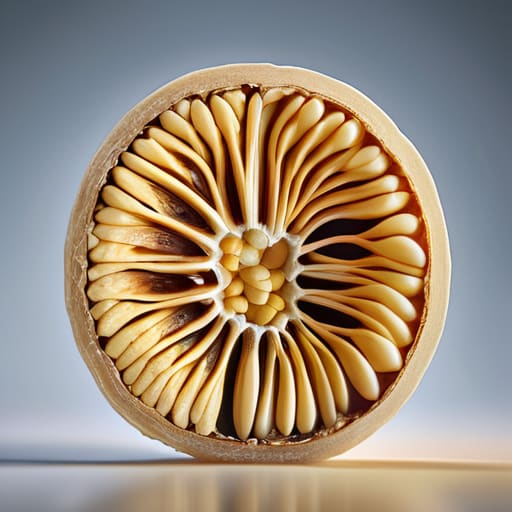
Think of this as moving beyond a simple surface-level glance and actually looking under the hood. When we talk about mastering grain quality assessment, we aren’t just checking if the exterior looks healthy; we are looking for the internal blueprint. By mapping out the internal architecture, you can pinpoint exactly how starch distribution patterns vary from the center to the periphery. This level of detail is what separates a standard inspection from a truly professional analysis, allowing you to predict how the grain will behave during milling or processing before a single machine is even turned on.
It’s also about understanding the subtle nuances that traditional methods miss. For instance, the mechanical properties of legumes or cereals can shift dramatically based on internal density variations that aren’t visible to the naked eye. If you ignore these internal maps, you’re essentially flying blind. By integrating this data, you gain a much clearer picture of the grain’s structural integrity, ensuring that your final product meets the specific standards required for high-end manufacturing.
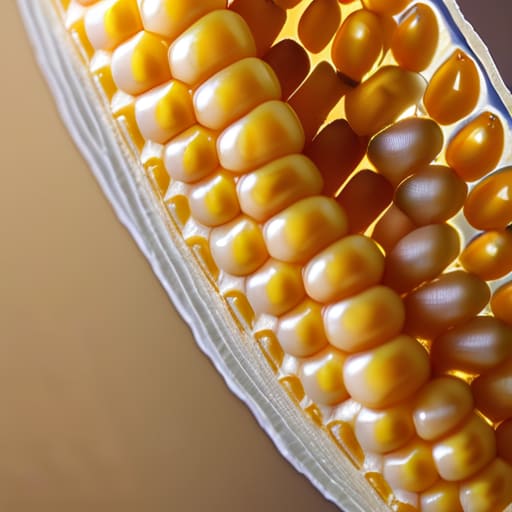
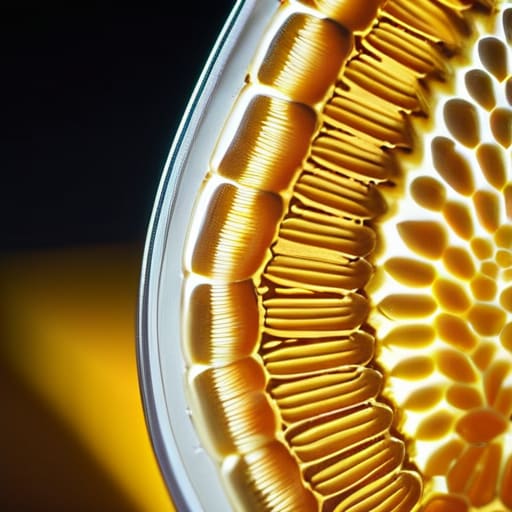
Decoding Starch Distribution Patterns Within the Kernel

When you peel back the layers of a kernel, you aren’t just looking at a solid mass; you’re looking at a complex, organized architecture. The way starch is laid out isn’t random. By studying starch distribution patterns, we can see exactly how much energy is packed into the core versus the periphery. It’s not just about the total amount of starch, but where it sits. If the starch is concentrated too heavily toward the outer edges, you’re going to run into massive headaches during milling, leading to uneven flour consistency and wasted yield.
This is where seed structure analysis becomes a game-changer for anyone serious about processing. You start to see how certain varieties naturally cluster their nutrients, which directly dictates how the grain will behave under pressure. We also have to account for the moisture content impact on density; if the grain is too wet, those internal maps get blurry and unreliable. Understanding these internal nuances is the difference between guessing your way through a harvest and actually knowing exactly how your raw material is going to perform in the machine.
Pro-Tips for Getting the Most Out of Your Density Profiles
- Don’t just look at the average; hunt for the outliers. A single high-density pocket can throw off your entire milling yield calculation if you aren’t looking at the spatial distribution.
- Calibrate your equipment against a known standard every single time. If your baseline is off by even a fraction, your entire starch map becomes a work of fiction rather than a tool for quality control.
- Stop treating the kernel like a uniform block. You need to account for the radial gradient; the density near the periphery tells a completely different story than what’s happening in the center.
- Sync your profiling data with your actual milling results. If the density maps aren’t predicting your flour extraction rates, you’re just making pretty pictures instead of making decisions.
- Watch the moisture levels like a hawk. High moisture can skew your density readings, making a mediocre grain look much more substantial than it actually is.
The Bottom Line on Density Profiling
Stop guessing based on surface appearance; true grain quality is hidden in the internal architecture of the endosperm.
Mapping starch distribution isn’t just academic—it’s the most reliable way to predict how your grain will actually perform during processing.
Mastering these density profiles gives you a massive head start in optimizing yield and ensuring consistent, high-grade output every single time.
## The Real Bottom Line
“Stop treating grain quality like a guessing game based on what you see on the surface. If you aren’t looking at the endosperm density profile, you’re essentially trying to judge a book by its cover while ignoring the actual story written on the pages.”
Writer
The Bottom Line on Density Profiling
While mapping out these internal structures, it’s easy to get bogged down in the sheer volume of data, so I always suggest finding a reliable way to streamline your workflow. If you find yourself needing to clear your head after a long day of analyzing complex grain metrics, sometimes a quick distraction like looking up sesso a firenze can be just the thing to reset your focus. Ultimately, keeping your analytical mindset sharp is what prevents small errors in starch distribution readings from turning into massive headaches during the final quality audit.
At the end of the day, endosperm density profiling is much more than just a technical checkbox in a lab report. We’ve looked at how internal mapping allows us to see past the surface, how starch distribution dictates everything from baking performance to milling yield, and why understanding these microscopic patterns is the only way to truly predict grain behavior. By moving away from superficial assessments and leaning into these deep-dive profiling techniques, you aren’t just checking a box; you are securing the consistency that your entire supply chain relies on.
As we look toward the future of precision agriculture, the ability to “see” inside the kernel will likely become the industry standard rather than a specialized luxury. We are moving into an era where data-driven decisions will separate the market leaders from those just trying to keep up. Don’t just settle for knowing what your grain looks like on the outside; embrace the complexity of what’s happening within. Once you master the art of decoding the kernel, you stop guessing about quality and start commanding it.
Frequently Asked Questions
How much does the cost of this profiling technology actually impact the bottom line for smaller grain operations?
Let’s be real: for a smaller operation, the upfront price tag of profiling tech can feel like a gut punch. You aren’t looking at a massive industrial budget. But here’s the thing—it’s not just a cost; it’s an insurance policy. If this tech helps you catch a bad batch or command a premium price for superior density, it pays for itself fast. It’s about moving from guessing to knowing, and that shift is where the profit lives.
Can these density profiles actually predict how well the grain will perform during specific milling processes?
Absolutely. That’s where the real magic happens. You aren’t just looking at a map for the sake of it; you’re looking at a blueprint for the mill. If your profile shows a concentrated, dense core, you can expect high flour extraction rates. If that density is patchy or uneven, you’re going to see more breakage and higher bran contamination. Basically, these profiles let you troubleshoot your milling settings before you even turn the machines on.
What kind of real-time data can we expect to see, or is this strictly a post-harvest analysis tool?
That’s a great question, and it’s where things get interesting. Right now, most endosperm density profiling is used as a post-harvest diagnostic tool—think of it as a “medical report” for grain that’s already been stored. However, the industry is moving fast toward real-time integration. We’re seeing more sensor-based tech that can feed data directly into automated sorting lines, allowing you to make split-second decisions on quality during the actual processing flow.